
Dynamic phenotyping of patients: AI embodies the classical Hippocrates’ ideas on medicine

Big Data, equipped with artificial intelligence methods reveal intrinsic dynamics of diseases and help to predict health crises.
The father of medicine, Hippocrates, was considering any patient with a particular disease as a process that can be characterized by the rules of its dynamics. For example, he introduced the term ‘crisis’ in a disease as a decisive bifurcation point, determining the patient’s fate at rather well defined moments of time. This notion of disease as a specific and complex dynamics is the opposite of the naive idea of a discrete diagnosis that defines disease as a condition or state. Following the ideas of the Koan’s school founded by Hippocrates, during many centuries the work of many thousands of best medical experts had the aim to transform the scrupulous observations on the millions of individual patients’ disease trajectories into standard medical protocols. Thanks to these efforts, today we can sometimes make a prognosis for a patient, and not merely diagnose his current condition. But we need much more: to identify typical crises and to make a reliable individual forecast.
Today we can investigate the patient’s organism more systematically than ever, even at molecular level. Sometimes we can record everything that happens with the whole nations in terms of health into billions of clinical records. Can these Big Data, equipped with artificial intelligence methods, accelerate the process of medical knowledge growth? This was the big question attacked by an international research group, comprising scientists from University of Leicester (UK), Institut Curie (France), Krasnoyarsk State Medical University and Lobachevsky University in Nizhny Novgorod, with a study recently published in GigaScience, a top Oxford Publishing group journal devoted to Big Data.
The Big Data point of view on medicine has been connected for long with the principle of clustering. The state of a patient can be represented as a vector in a multi-dimensional space combining all bits of information collected, including very precise molecular measurements. Collecting many such vectors, one can think of applying an unsupervised machine learning approach and define patient subgroups with similar states. The hypothesis is that each such a subgroup of patients requires a specific treatment. The more such information we are collecting, the more it is clear that we can identify more and more clusters which reflects more and more fine-grained patient classifications into disease subtypes. And quite strikingly, this approach appears to be in direct contradiction with the Hippocrates legacy, since by classifying the snapshot states of the patients, we tend to neglect the dynamical nature of the disease as a process.
The instantaneously observed state of a patient does not tell how the patient arrived there, the process that could take years and be preceded by other diagnoses. Right now, we are facing the paradigm change from defining a disease as a static snapshot of the organism’s state towards the notion of an individualized clinical or disease trajectory representing the history of a patient with interplay and mutual influences of multiple diagnoses. Millions of such trajectories can be grouped into dynamical phenotypes, representing fewer number of major stereotypical pathological scenarios. Modern methods of artificial intelligence based on collecting large amounts of clinically relevant data can help us to perform such dynamical patient phenotyping.
There is still one big problem in this respect. Reconstructing precise individual clinical trajectory requires long-term follow up of a patient, with systematic collection of the information about the state of the patient’s organism. These data (called longitudinal or diachronic observations) remain very difficult and expensive to collect. We have in possession much more synchronic (snapshot) data by observing patients within a relatively short period of time (for example, during the stay in a hospital). Is It possible to reconstruct clinical trajectories and dynamic phenotypes from such observations?
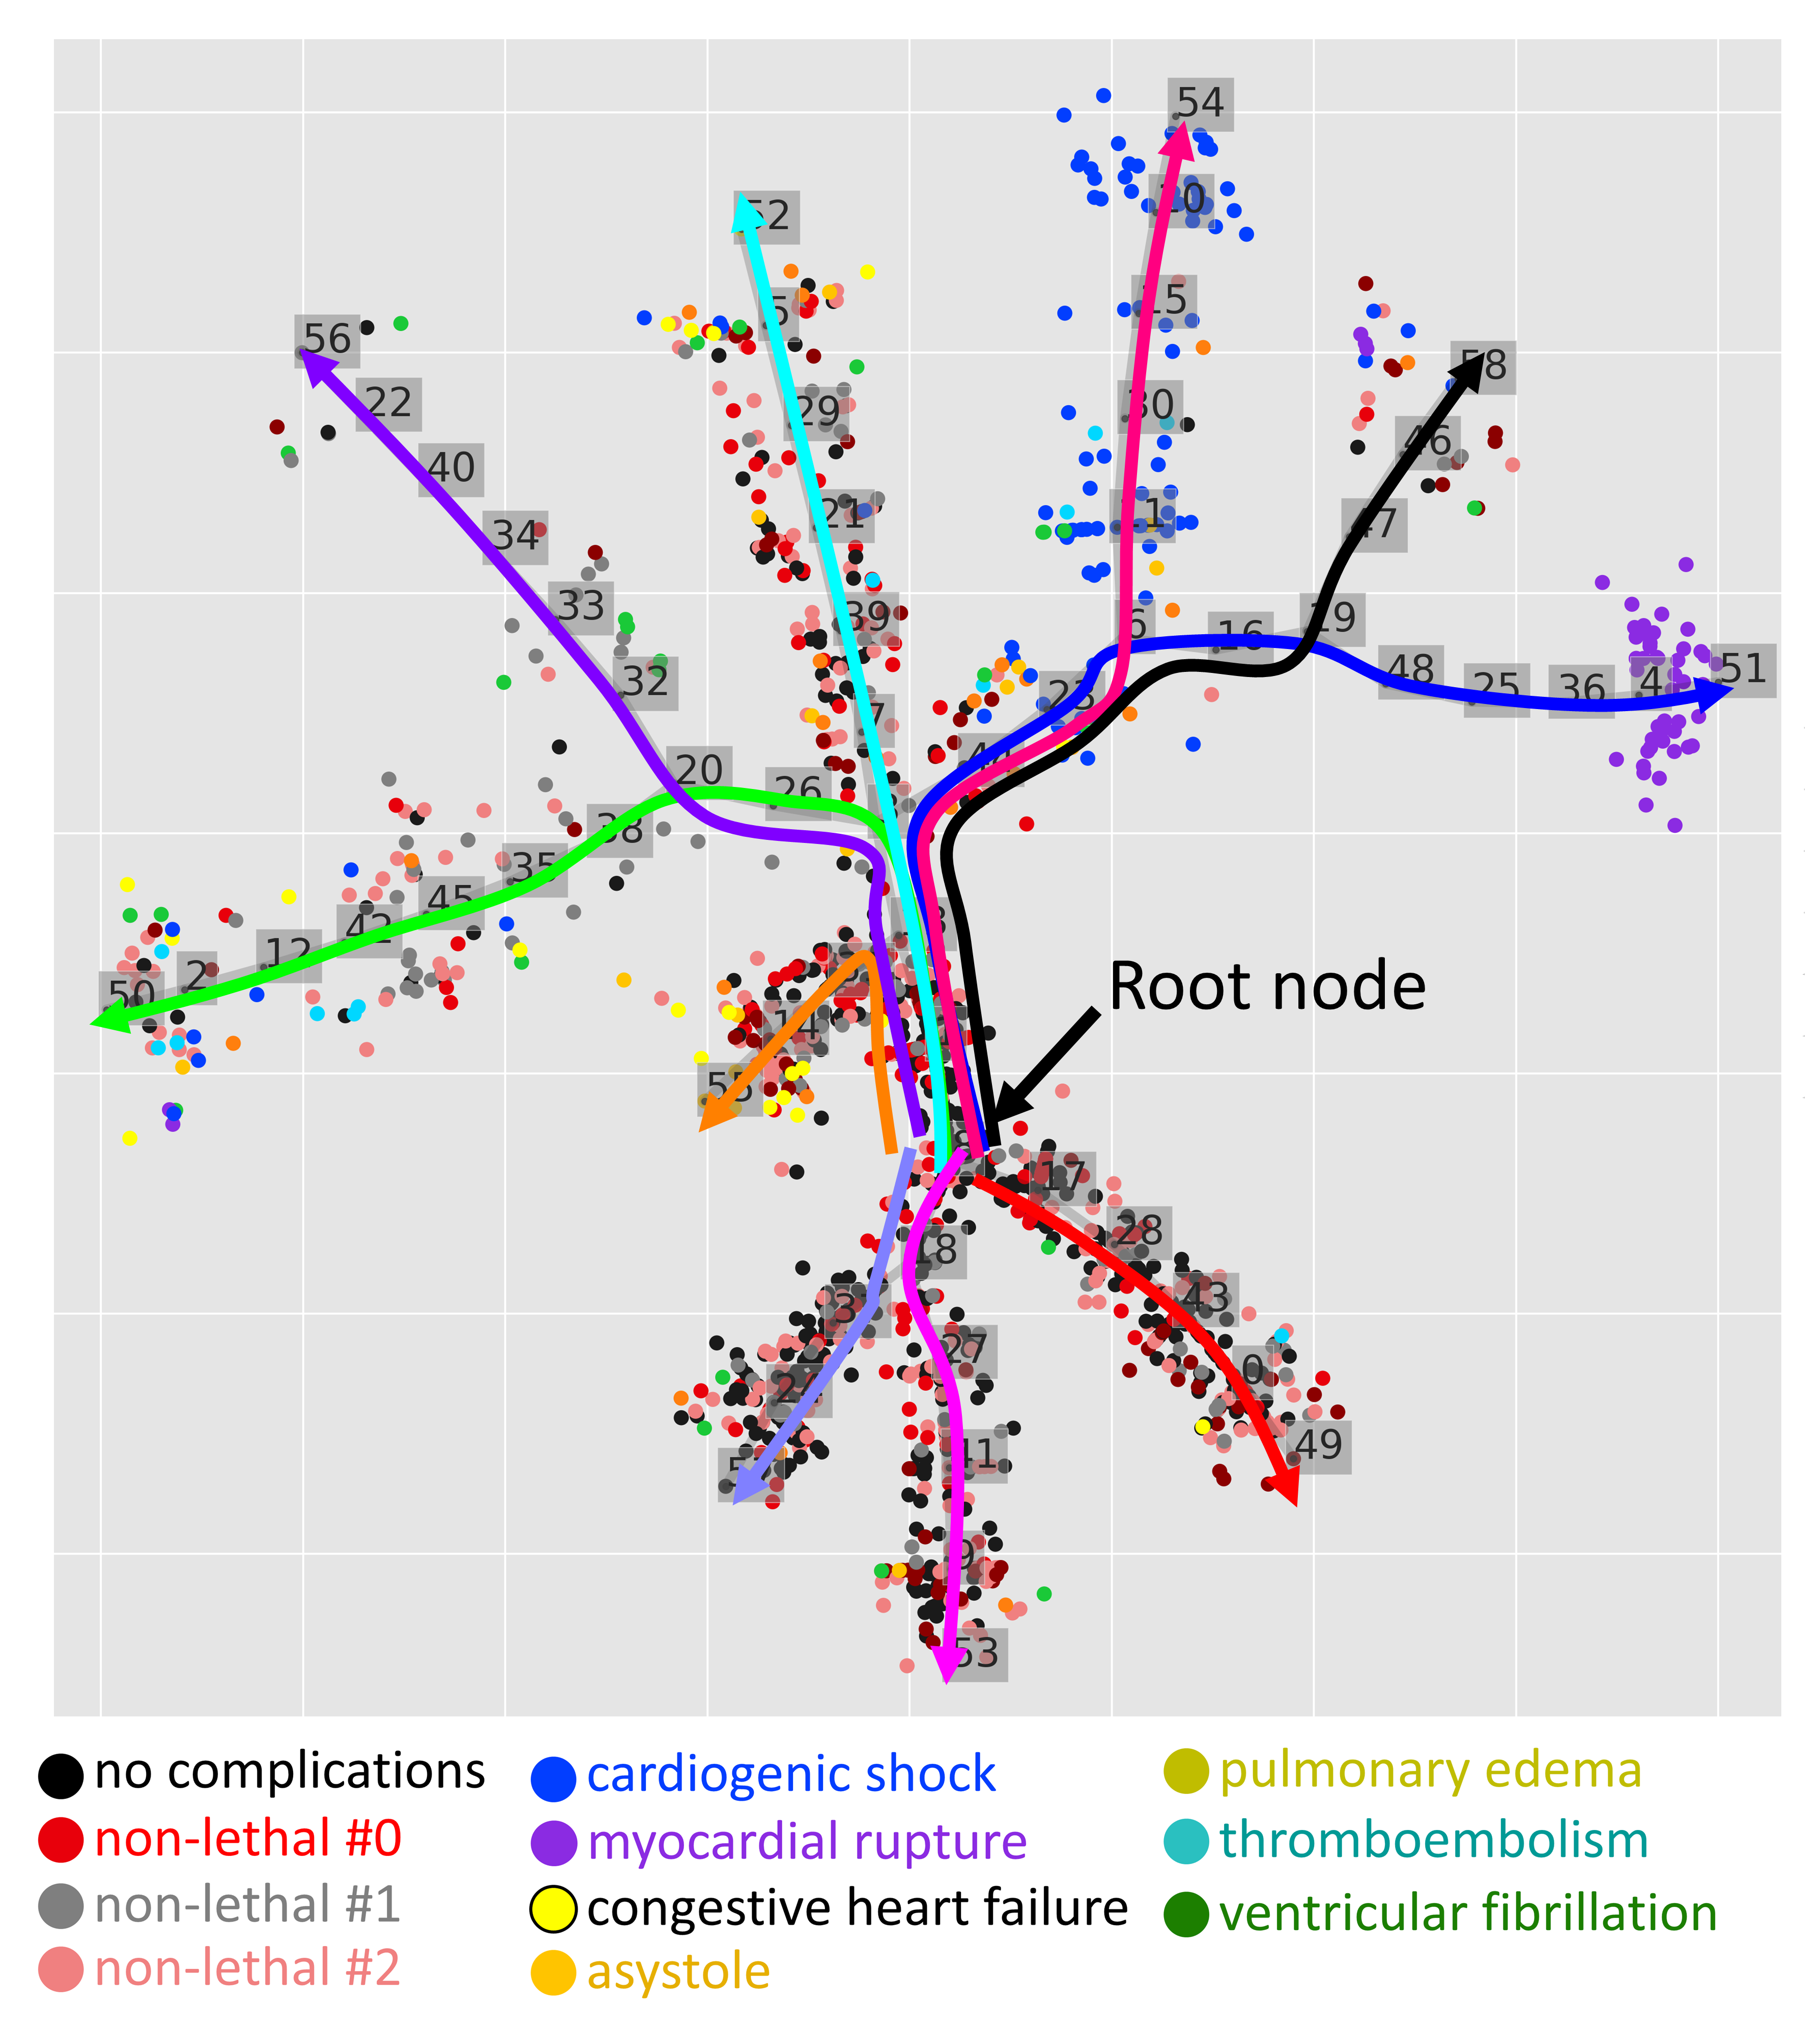
In the published study undertaken by Alexander Gorban, Professor at the University of Leicester and and the PI of Megagrant “Scalable Artificial Intelligence Networks for Data Analysis in Growing Dimensions” at Lobachevsky University, Andrei Zinovyev (Institut Curie, France) and their collaborators, the researchers made a hypothesis that if the number of synchronic observations is large, then they will map the structure of clinical trajectories because each patient would represent a different state of a progressing disease, along a particular disease trajectory. Then the large-scale clinical data can be modeled as a bouquet of diverging clinical trajectories, even if the nature of the data is synchronic and none of the patients is followed for a long time. The root of this bouquet corresponds to the least complicated disease state, the onset of many possible pathological scenario. The leafs of the bouquet map the terminal states, corresponding to the lethal or chronic heavy disease states. It was suggested to model the clinical data using an advanced machine learning approach called principal trees, based on the idea of topological grammars, developed by the same authors earlier and successfully applied in other fields such as the analysis of single cell datasets.
The approach was applied to two large publicly available observational clinical datasets from the two most challenging areas of public health: cardiology and diabetes. The first dataset was collected by Professor Sergey Golovenkin, the leading author of the study, at the Krasnoyarsk Interdistrict Clinical Hospital (Russia) in 1992-1995 years, but has only recently been deposited to the public domain The analysis based on application of principal trees identified ten distinct clinical trajectories such that each patient can be classified as following one of them, after the incident of myocardial infarction. Each of the trajectories is characterized by a distinct patterns of lethality and other complications together with specific risk factors: therefore, determining the type of the patient’s trajectory as early as possible should influence the choice of treatment and increase the chances for its success.
In the second part of the study, a large dataset representing 10 years (1999-2008) of clinical care of patients with diabetis at 130 US hospitals and integrated delivery networks was analysed. The authors also identified existence of clinical trajectories which were distinct in terms of the probability of readmission to a hospital within one month after leaving it. In this case, identifying the clinical trajectory can help adjusting the diagnostics procedures (in particular, performing the test for glycated hemoglobin HbA1c) should improve the care in order to minimize the chances for early readmission.
The researchers state that the suggested methodology is general enough to be applied to many different diseases and types of data. It can improve the analysis of electronic clinical records as well as the results of continuous patient monitoring using wearable medical devices.
Golovenkin, S. E., Bac, J., Chervov, A., Mirkes, E. M., Orlova, Y. V., Barillot, E.,Gorban A. N. & Zinovyev, A. (2020). Trajectories, bifurcations, and pseudo-time in large clinical datasets: applications to myocardial infarction and diabetes data. GigaScience, 9(11), giaa128. https://doi.org/10.1093/gigascience/giaa128
Software is available online:
Methodology and software for quantifying pseudotemporal trajectories in clinical datasets.
https://github.com/sysbio-curie/ClinTrajan
The myocardial infarction data are published with the paper:
Golovenkin, S. E., Bac, J., Chervov, A., Mirkes, E. M., Orlova, Y. V., Barillot, E.,Gorban A. N. & Zinovyev, A. Supporting data for “Trajectories, bifurcations and pseudo-time in large clinical datasets: Applications to myocardial infarction and diabetes data." GigaScience Database 2020 . http://dx.doi.org/10.5524/100819
.
Figure. Ten clinical trajectories extracted from myocardial infarction complication dataset, collected by Krasnoyarsk State Medical University (Russia). Each point represents an observation of a patient with myocardial infarction diagnosis, the color denotes possible complications of this disease.


